
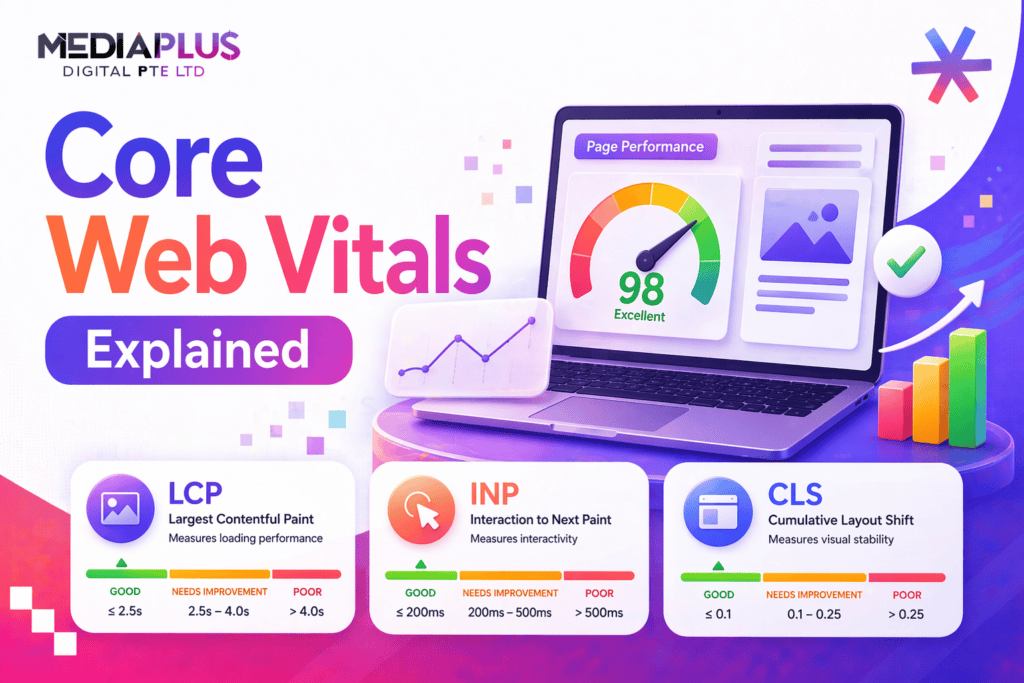
Core Web Vitals are the three metrics Google uses to measure how real users experience your pages: how fast they load, how quickly they respond, and how stable they look. They feed into Google’s page experience signals, so they affect both your visitors and your rankings. This guide explains each metric in plain English, the 2026 thresholds, and what to do when a page fails.
The three metrics at a glance
|
Metric |
Measures |
Good |
Needs work |
Poor |
|
LCP (Largest Contentful Paint) |
Loading speed |
2.5s or under |
2.5s to 4s |
Over 4s |
|
INP (Interaction to Next Paint) |
Responsiveness |
200ms or under |
200ms to 500ms |
Over 500ms |
|
CLS (Cumulative Layout Shift) |
Visual stability |
0.1 or under |
0.1 to 0.25 |
Over 0.25 |
Google judges these at the 75th percentile of real visits, meaning at least 75% of your visits must hit the “good” mark for the page to pass.
Largest Contentful Paint (LCP)
LCP marks the moment the largest visible element, usually a hero image, heading or banner, finishes loading. It is the closest single number to “how fast did the page feel”. Slow LCP usually comes from large unoptimised images, slow servers or render-blocking resources.
How to improve it:
- Compress and correctly size hero images, and serve modern formats like WebP.
- Use a CDN and good hosting to cut server response time.
- Preload the main image or font and defer non-critical scripts.
Interaction to Next Paint (INP)
INP measures how quickly the page responds when a user taps, clicks or types. It replaced First Input Delay in March 2024 and is now the most commonly failed Core Web Vital, with around 43% of sites missing the 200ms target in 2026. Heavy JavaScript is the usual culprit.
How to improve it:
- Break up long JavaScript tasks so the main thread stays free.
- Remove or defer unused scripts and third-party tags.
- Keep event handlers light and avoid blocking the page during interaction.
Cumulative Layout Shift (CLS)
CLS measures unexpected movement, the annoying jump when an image or ad loads and pushes the button you were about to tap. A score of 0.1 or less keeps the page feeling stable.
How to improve it:
- Set explicit width and height on images and video.
- Reserve space for ads, embeds and banners before they load.
- Avoid inserting content above existing content unless triggered by the user.
How to measure your Core Web Vitals
Use these free tools, which draw on both lab and real-world data:
- PageSpeed Insights for a single-page lab and field report.
- Google Search Console (Core Web Vitals report) for site-wide grouping by issue.
- Chrome User Experience Report (CrUX) for the real-world field data Google actually uses.
- Lighthouse in Chrome DevTools for debugging during development.
Field data reflects real visitors, so it is what counts for ranking. Lab data is useful for diagnosing why a page is slow.
Where Core Web Vitals fit in your SEO
Core Web Vitals are one part of technical health, not the whole picture. They work alongside crawlability, indexing and content quality. For the wider view, see our guide to technical SEO and on-page SEO. Because so many fixes are design decisions, our responsive web design best practices guide pairs well with this one.
Only around 47% of sites currently pass all three thresholds, so getting yours into the green is a genuine competitive edge. If you want help diagnosing and fixing your scores, explore our SEO services or our web design and development team.